Where Does PHP Request Time Go When the Database Is Not the Bottleneck?
Where Does PHP Request Time Go When the Database Is Not the Bottleneck?
A PHP request can be slow even when its database query timings look fine.
GET /api/orders takes 1,000ms.
Laravel Debugbar shows 100ms of database queries. Telescope shows the request, the queries, the logs, and the response. Nothing looks catastrophic. No query takes 400ms. No exception is thrown. The cache is not obviously broken.
So where did the other 900ms go?
The screenshots in this article were captured from a local Laravel 12 testbed using the real laravel/telescope and barryvdh/laravel-debugbar packages. The exact numbers in that run are smaller than the opening example, but the shape is the same: the request takes hundreds of milliseconds while the query panel accounts for only a few milliseconds.
This is a common PHP performance debugging dead end. The tools show useful evidence, but the slow part of the request is not always a query, an exception, or an external service call. Sometimes the slow part is the PHP runtime path between those visible events.
The tools are useful
Laravel Telescope and Debugbar are useful tools. So are Symfony’s profiler, WordPress debugging plugins, query logs, request logs, and framework timelines. They help developers see what happened around a request.
They are especially good at surfacing:
- Which route or controller handled the request
- Which SQL queries ran
- How long the database reported spending on those queries
- Which cache calls, jobs, events, notifications, or logs were recorded
- Whether an exception happened
- Basic request and response metadata
That matters. If a request runs 300 queries, you want to know. If one query takes 800ms, you want it visible. If a job was dispatched or an exception was swallowed, request debugging tools can save a lot of time.
The gap appears when those visible events do not explain the total request time.
If the endpoint takes 1,000ms and query time accounts for 100ms, a query panel has done its job. It has told you the database is probably not the whole story. It has not told you what PHP did with the other 900ms.
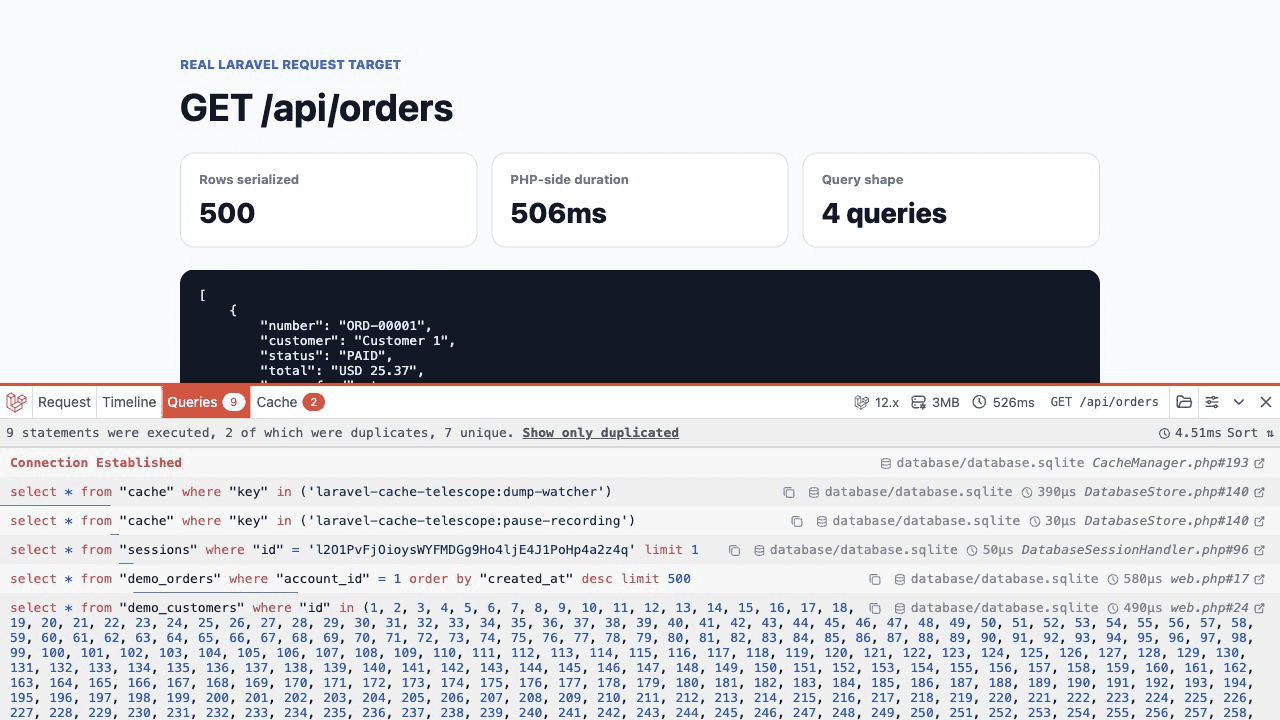
A real Debugbar query panel shows the shape of the dead end: the request took about 526ms, SQL timing was visible at about 4.5ms, and the remaining PHP work was still opaque from this view.
The missing middle
For a Laravel JSON endpoint, the expensive work can sit between the query and the response.
public function index(Request $request)
{
    $orders = Order::query()
        ->whereBelongsTo($request->user()->account)
        ->latest()
        ->limit(500)
        ->get();

    return OrderResource::collection($orders);
}
The SQL might be fast. The query panel might show a reasonable total. But the request still has to hydrate 500 Eloquent models, run casts, resolve accessors, execute resource logic, check permissions, format values, walk relationships, build arrays, and encode the JSON response.
The cost may be in code like this:
public function toArray(Request $request): array
{
    return [
        'id' => $this->id,
        'number' => $this->number,
        'customer' => new CustomerResource($this->customer),
        'latest_payment' => new PaymentResource($this->latestPayment),
        'can_refund' => $request->user()->can('refund', $this->resource),
        'total' => MoneyFormatter::forAccount($request->user()->account)->format($this->total),
        'status_label' => $this->status_label,
    ];
}
None of that has to look suspicious in code review. It is normal Laravel code. The problem is scale and placement.
If that resource runs for 500 orders, a cheap accessor becomes repeated work. A policy check becomes a loop. A formatter that loads account settings becomes request time. A relationship that is not loaded can become more queries. A nested resource can walk a lot more data than the API response needs.
Debugging panels can show the queries around this work. They usually do not show the full PHP call path that made the work expensive.
Query time is not request time
“The queries look fast” is not the same as “the endpoint is fast.”
The database is one part of the request. PHP still pays for everything around it:
- Model hydration
- Attribute casting
- Accessors and appended attributes
- Collection transforms
- Authorization checks
- Event listeners and observers
- Middleware
- View rendering or API resources
- Package callbacks
- Template partials
- JSON serialization
- Memory allocation from large intermediate arrays
This is not only a Laravel issue. Symfony apps can hide cost in event subscribers, serializers, form normalization, Twig rendering, voters, and bundles. WordPress can hide cost in hooks, filters, themes, plugins, WooCommerce callbacks, and admin-ajax.php. Custom PHP apps can hide cost in service classes, helpers, Composer packages, and data mappers.
The shape changes by framework, but the debugging problem is the same. A request can spend most of its time in PHP code that ordinary query and request panels only point around.
Manual timers are the usual fallback
When the missing time is large enough, developers start adding timers.
$start = microtime(true);

$orders = Order::query()
    ->whereBelongsTo($request->user()->account)
    ->latest()
    ->limit(500)
    ->get();

logger()->info('orders query finished', [
    'ms' => (microtime(true) - $start) * 1000,
]);

$start = microtime(true);
$response = OrderResource::collection($orders);

logger()->info('resource finished', [
    'ms' => (microtime(true) - $start) * 1000,
]);

return $response;
This can work for one investigation. It is also a sign that the existing evidence is not specific enough.
Manual timers have a few problems:
- You have to guess where to put them.
- They measure blocks, not the functions inside those blocks.
- They usually skip framework and vendor code.
- They are noisy to deploy and easy to forget.
- They do not naturally show repeated small work.
- They do not explain memory allocation or call count.
If the first timer says “resource serialization took 700ms,” you still have another search. Which resource method? Which accessor? Which policy? Which package call? Which nested relationship? Which formatter?
That is why teams end up moving timers deeper and deeper until the logs become a temporary profiler.
Profiling shows the runtime path
A profiler answers a different question.
Instead of showing only the request summary and visible framework events, it shows what PHP actually ran inside the request. The useful output is not just “this endpoint was slow.” It is the call path that explains the slowness.
For the GET /api/orders example, a profile can show whether the missing time went into:
OrderResource::toArray()- Eloquent model hydration
- Repeated relationship access
- Policy checks
- Money or date formatting
- A package callback under a resource or accessor
- JSON serialization
- Middleware or request bootstrapping
- Memory-heavy array construction
It can also show whether the work is one wide expensive call or thousands of smaller calls that add up. That distinction changes the fix.
One expensive serializer might need a narrower response shape. Thousands of repeated policy checks might need batching. Hydrating too many models might need pagination, column selection, or a different query shape. Repeated relationship access might need eager loading. A hot package callback might need to move out of the per-row path.
The fix starts to become concrete because the request has a shape.
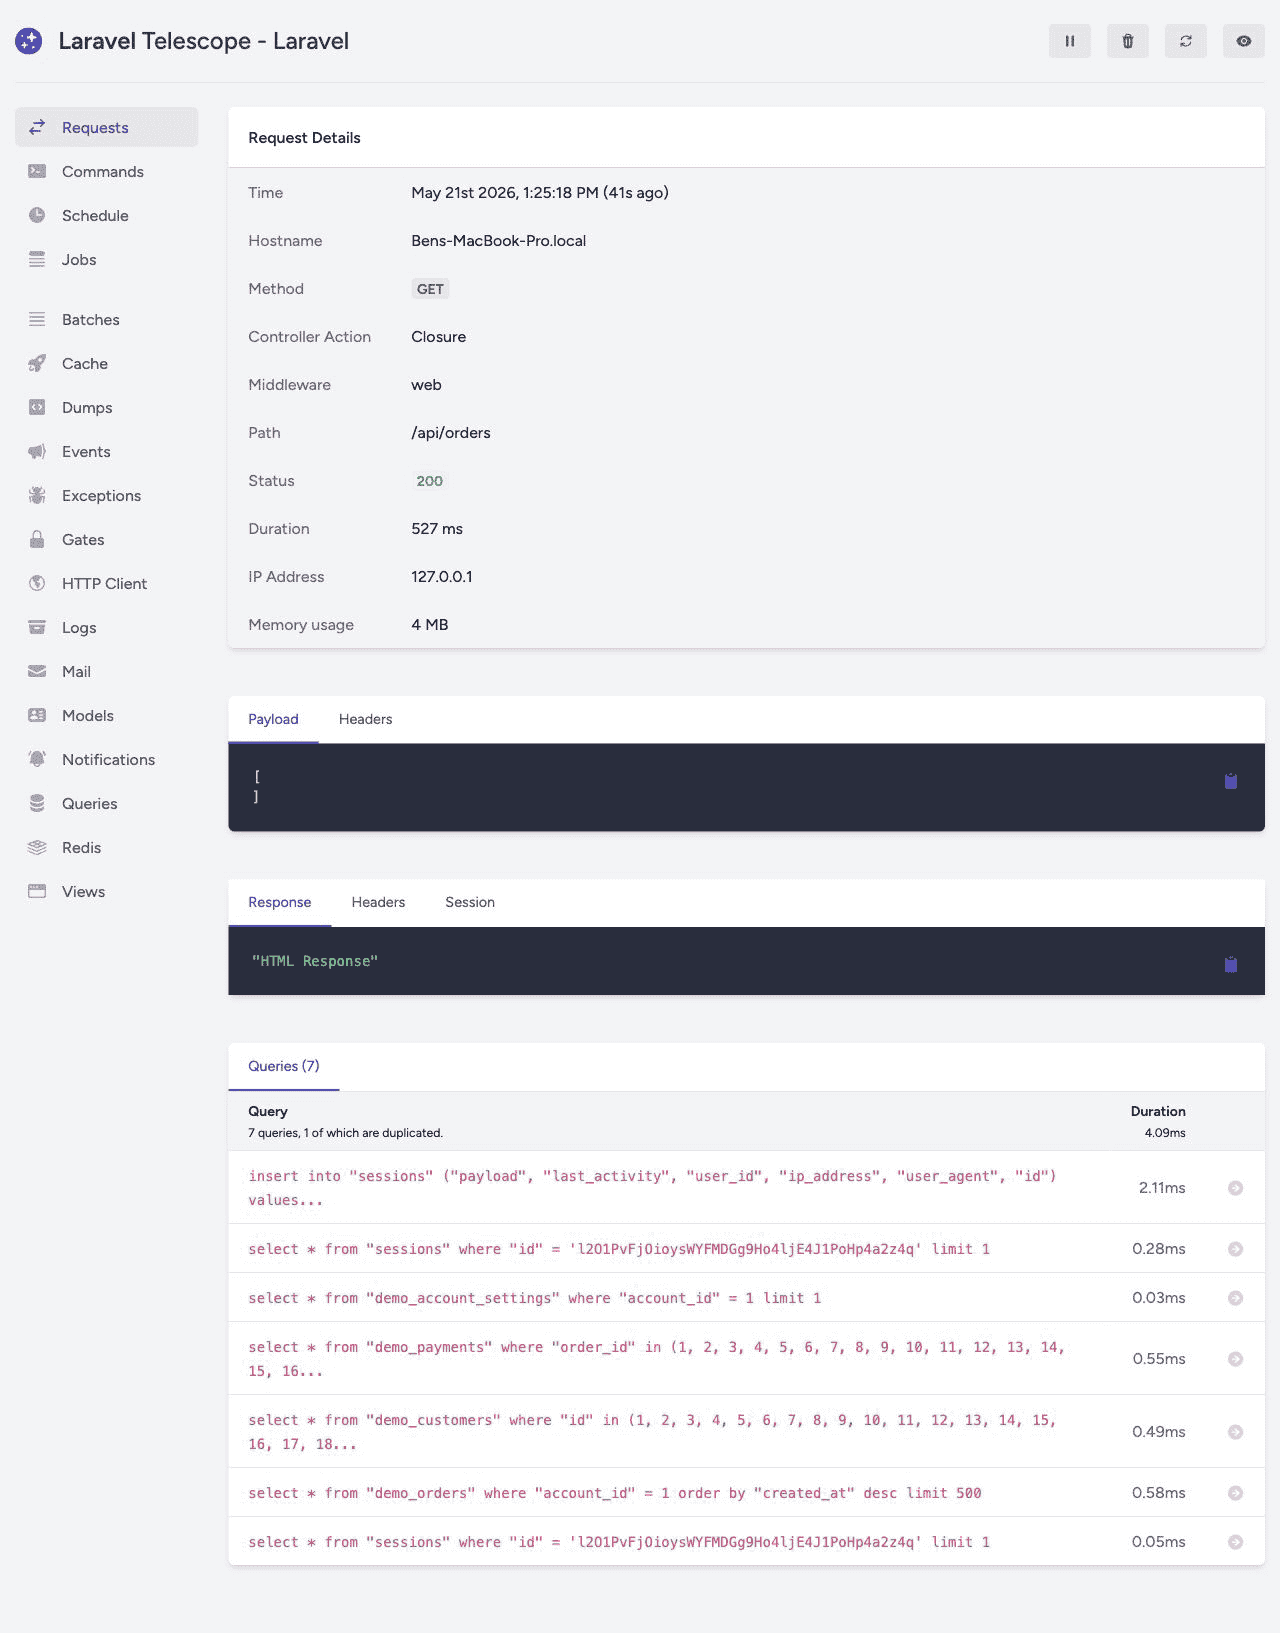
Telescope gives a similar clue. It confirms the request, status, duration, query list, headers, session, and response, but it still does not break the rest of the request into the PHP functions that used the time.
What to check when time is missing
When request time and visible query time do not add up, do not stop at “PHP is slow.” That label is too broad to fix.
Check the missing middle:
- Which controller, handler, command, job, or hook owns the slow action?
- How much total time is explained by database, cache, HTTP, and file activity?
- Which PHP call paths account for the rest?
- Are the expensive paths application code, framework code, or vendor code?
- Is the cost concentrated in one call, or repeated across many small calls?
- Do memory allocation and response size grow together?
- Does the same action look better after one narrow change?
This is the same practical split described in APM vs Profiling: What PHP Teams Actually Need: request-level tools can narrow the symptom, but profiling explains the PHP code path you can change.
Where Perfbase fits
Perfbase is built for the part of PHP debugging that request and query panels usually flatten.
It captures PHP function calls, wall time, CPU time, memory allocation, call counts, database queries, cache operations, HTTP calls, and file I/O from inside the runtime. In the console, those traces become flame graphs, function tables, query analysis, and timelines, so you can move from “the endpoint took 1,000ms” to “this resource path spent 620ms formatting and serializing 500 hydrated models.”
That does not make Telescope, Debugbar, Symfony’s profiler, WordPress debugging plugins, or query logs obsolete. Keep using them. They are good at what they show.
The point is that they do not always show enough.
When the database explains 100ms and the request took 1,000ms, you need to see what PHP did with the rest. Read the flame graph guide if you want a practical walkthrough of that view, or start with the setup guide when you are ready to profile real requests.
The next time a request has missing time, do not fill the codebase with timing logs first.
Get the call path.
Building Perfbase - PHP performance monitoring for teams. Passionate about making PHP applications faster and more observable.
Related posts
The Hidden Cost of WordPress Plugins
Next →Know When a PHP Endpoint Slows Down Before Someone Reports It
Ready to profile your PHP application?
Start on the free-forever plan. No credit card required.