Official WordPress Support Is Here
Official WordPress Support Is Here
Today we are officially releasing Perfbase support for WordPress.
The plugin is available from the WordPress plugin directory: Perfbase on WordPress.org. That gives WordPress and WooCommerce teams a normal plugin install path for connecting Perfbase’s PHP profiler to real WordPress traffic.
This is first-party support for the WordPress surfaces that tend to hurt in production: public page views, WooCommerce flows, admin-ajax.php, cron, REST requests, wp-admin work, and WP-CLI when you choose to enable it.
A WordPress performance problem usually starts with something concrete. The checkout step takes too long. admin-ajax.php keeps showing up in request logs. A scheduled task drags during a campaign. The order screen in wp-admin feels slow enough that the team avoids opening it unless they have to.
Those problems are not solved by knowing that “WordPress is slow.” They are solved by finding the PHP work that ran for that request, the callback, plugin, query pattern, or external call that made it expensive, and then changing the smallest piece of code or configuration that caused it.
What this release includes
Profiling WordPress still has two parts.
First, install the Perfbase PHP extension. The extension is what records the native PHP call path, timing, memory, database, cache, HTTP, and file I/O signals underneath WordPress.
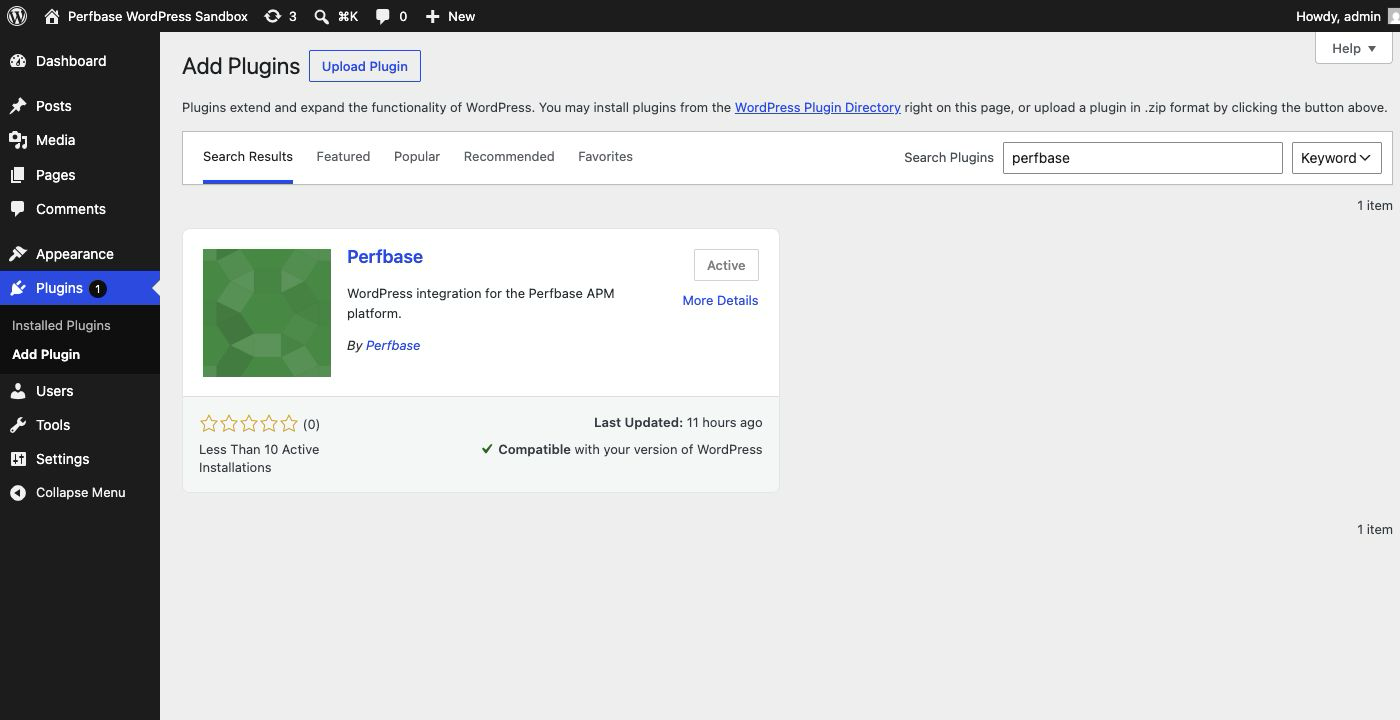
Then install the WordPress plugin from WordPress.org. From wp-admin, go to Plugins > Add New, search for Perfbase, install it, and activate it like any other plugin. After activation, configure the API key and profiling options in Settings > Perfbase.
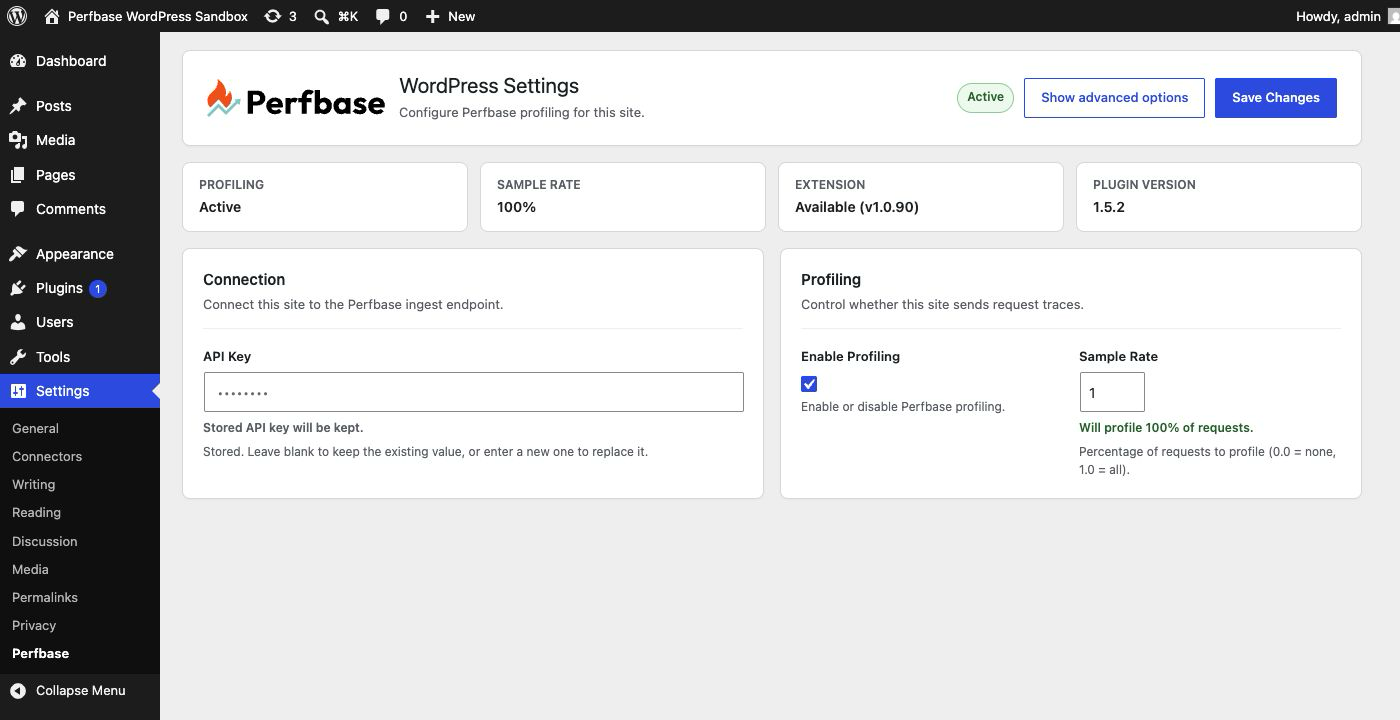
The full setup steps live in the WordPress integration guide. The important change is that the classic WordPress install path now points at WordPress.org, which is where WordPress operators expect plugin installation and updates to start.
What happens after activation
The plugin is not just a transport wrapper.
It connects the native PHP profile to the way WordPress actually runs. Profiling starts early in the request lifecycle on init and finishes late on shutdown, so the trace can include plugin loading, theme setup, templates, filters, REST handling, outbound HTTP, database work, and shutdown behavior.
The plugin also separates common WordPress execution contexts:
- Standard HTTP requests use the
httpspan. - AJAX requests use the
ajaxspan and keep the sanitized AJAX action as request context. - WordPress cron runs use the
cronspan. - WP-CLI commands can use the
clispan when enabled.
That matters because a slow product page, a slow cart fragment refresh, a slow cron execution, and a slow admin import are different debugging problems. Grouping them together as generic PHP requests makes the profile harder to act on.
Start with the request that hurts
After installing the plugin, do not try to profile everything at once.
Pick the surface that is causing the most friction:
- A WooCommerce checkout step that feels sticky.
- A product page that slows down under real catalogue data.
- An AJAX action that appears as repeated
admin-ajax.phptraffic. - A cron run that takes longer after content or order volume grows.
- A
wp-adminscreen where custom columns, metaboxes, or notices are doing too much work.
Perfbase samples eligible work by default, so you can start with production-safe sampling instead of turning every request into a trace. AJAX and cron profiling are enabled by default. Admin and WP-CLI profiling are available, but they should be enabled deliberately when those contexts are the investigation target.
That gives you a useful starting posture: capture enough real traces to see the runtime path, but keep the profiling scope tied to the request you actually need to explain.
WordPress context makes the profile useful
Raw PHP profiling is useful, but WordPress context is what makes the first pass faster.
If the trace is an AJAX request, the action matters more than the admin-ajax.php URL. If WooCommerce is active, the page type matters: shop, product, cart, checkout, account, cart addition, or order creation. If the request came through REST, the route matters. If the profile is for an admin screen, the fact that it is admin traffic changes the debugging question.
Perfbase records those WordPress-specific details as trace attributes while keeping the span names low-cardinality. The profile still shows the PHP call tree underneath, but the trace starts with enough product context to tell what kind of WordPress work you are looking at.
That is the difference between:
POST /wp-admin/admin-ajax.php took 1.4sand:
ajax.cart_refresh spent most of its time inside one WooCommerce callbackThe first line tells you there is a problem. The second points at the first place to inspect.
A practical first profile
For a new WordPress install, a useful first workflow looks like this:
- Install the PHP extension.
- Install and activate the Perfbase plugin from WordPress.org.
- Add the project API key in Settings > Perfbase.
- Keep the default sample rate at
0.1while checking production behavior. - Reproduce the slow request or wait for sampled production traces.
- Open the trace and inspect the hottest call path, repeated functions, query patterns, and WordPress attributes.
- Change the smallest thing that explains the measured cost.
- Capture the same request again and compare.
That last step is easy to skip, but it is the part that keeps the fix honest. A profile should give you a reason for the change, and the next profile should show whether the reason was right.
Use the plugin to narrow the work
Most WordPress performance fixes are smaller when the evidence is specific.
If a trace shows a callback repeatedly loading post meta inside a product loop, the fix may be a data access change. If a checkout customization spends time in outbound HTTP, the fix may be moving the call away from the user-facing path. If an admin list table is slow because a custom column calculates live data for every row, the fix may be caching or precomputing that value.
Those are targeted changes. They are easier to review than removing plugins blindly, swapping themes, or increasing server size because no one can tell where the time went.
Official WordPress support does not change what Perfbase is trying to do. It makes the path into that workflow more natural for WordPress teams: install the extension, install the plugin from WordPress.org, profile the request that hurts, then follow the PHP call path until the fix is smaller. That is the same debugging loop behind finding where PHP request time goes when the database is not the bottleneck.
Read the WordPress integration guide for setup details, or read The Hidden Cost of WordPress Plugins for a deeper look at how plugin, hook, AJAX, cron, and WooCommerce behavior shows up in real profiles.
Building Perfbase - PHP performance monitoring for teams. Passionate about making PHP applications faster and more observable.
Related posts
Ready to profile your PHP application?
Start on the free-forever plan. No credit card required.