Introducing Perfbase: PHP Profiling for Requests, Jobs, and Commands
Introducing Perfbase: PHP Profiling for Requests, Jobs, and Commands
A slow PHP endpoint rarely points at one obvious cause. The route is slow, but the database panel only explains part of it. A queue job takes longer after a release, but the logs are clean. A WordPress page is fine in one context and expensive in another because a plugin, hook, template, or serializer did more work than expected.
Perfbase exists for that debugging step: when you need to see what PHP actually did during one request, job, command, or framework lifecycle.
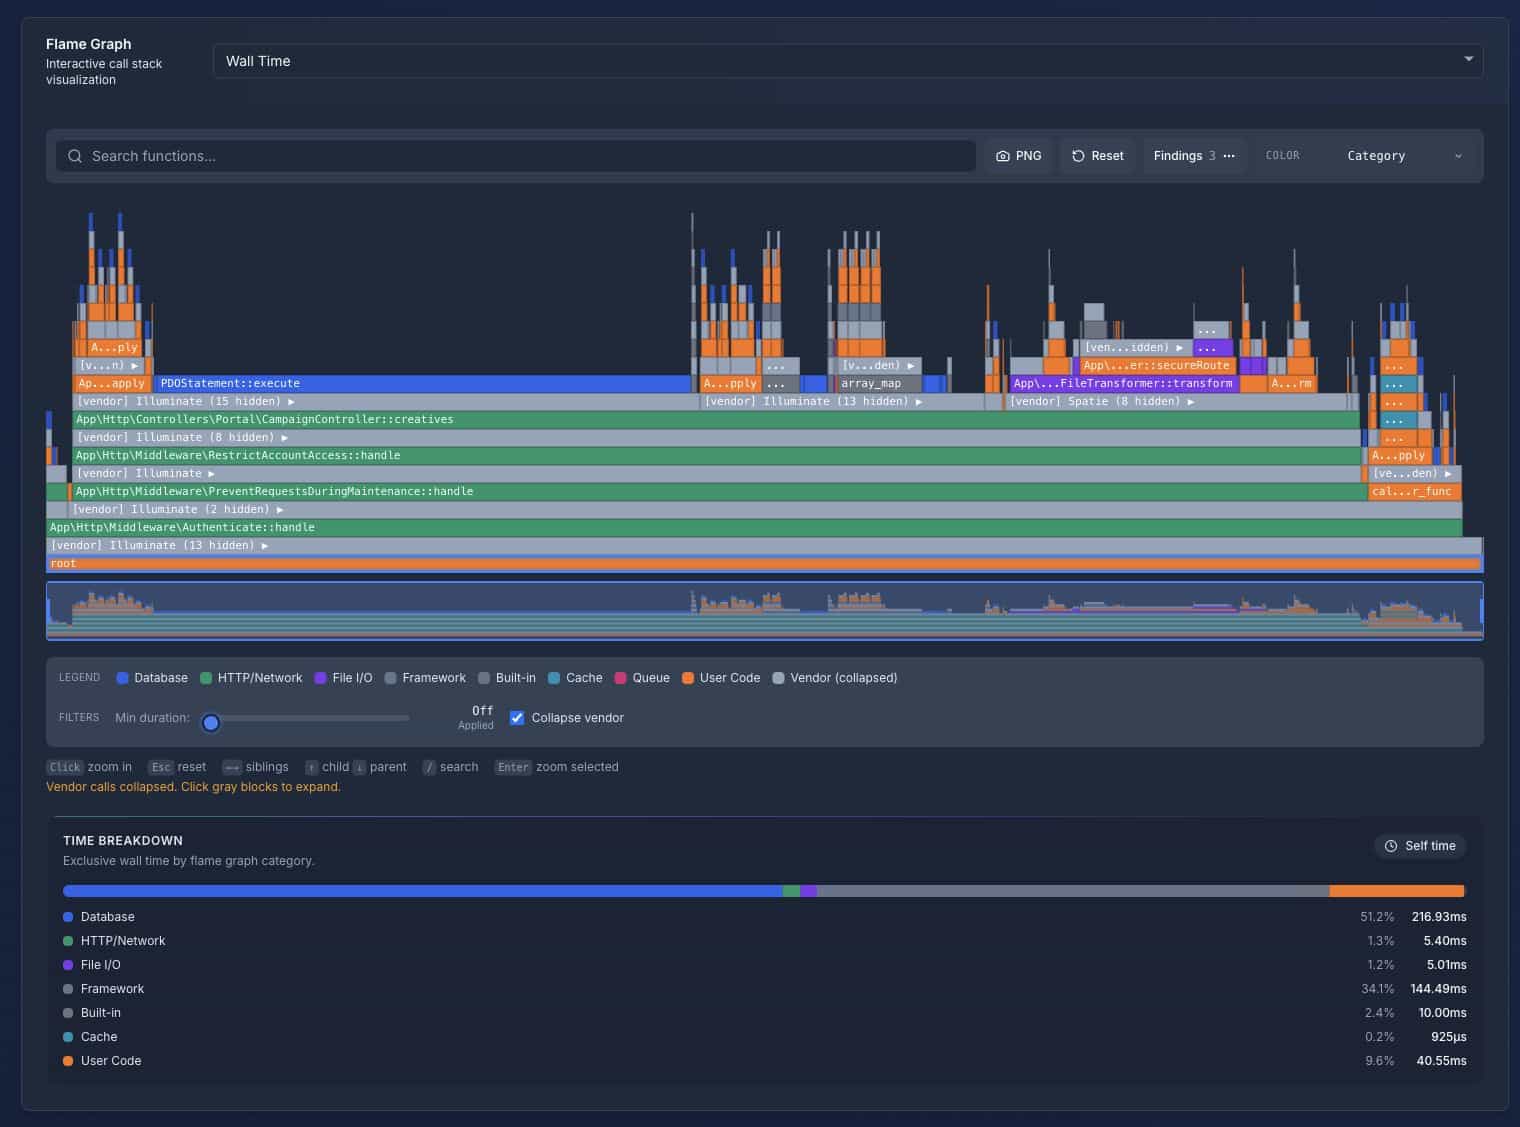
With vendor calls collapsed, the trace keeps framework and package cost visible without letting dependency internals dominate the first read.
What is Perfbase?
Perfbase is a PHP profiling platform built around runtime traces. Install a native PHP extension, connect a framework package, and profile HTTP requests, queue jobs, and CLI commands without adding timers around every block of code you suspect.
Each trace can show:
- PHP function call paths with wall time, CPU time, memory, and call counts.
- Database queries and normalized query patterns, so repeated query shapes stand out.
- Cache, HTTP, file, mail, and selected library activity when those trace features are enabled.
- Framework context such as the route, action, job, command, status code, environment, and application version.
- Host resource samples, so a slow trace can be checked against CPU, memory, disk, and network pressure.
That makes Perfbase useful when request-level monitoring tells you something is slow, but you still need the code path that explains why.

A production trace can put wall time, call volume, database work, and N+1 signals next to each other before you open the full call path.
How it works
Perfbase has three parts.
The first is a native PHP extension written in Rust and C. It hooks into the Zend engine using the Observer API on PHP 8.2+ and zend_execute_ex wrapping on older supported versions. That gives the profiler visibility into the runtime path without requiring code annotations in every controller, service, hook, or package callback.
The second is a framework integration. The Laravel integration can profile HTTP requests, jobs, and Artisan commands. The WordPress plugin profiles WordPress request lifecycles, hooks, plugins, themes, and WooCommerce paths. Other integrations cover Symfony, Drupal, CakePHP, Slim, Joomla, CodeIgniter, Yii, and the standalone PHP SDK.
The third is the web console, where traces become flame graphs, function tables, query analysis, and trace-level views you can compare before and after a fix.
Setup starts with the extension:
bash -c "$(curl -fsSL https://cdn.perfbase.com/install.sh)"Then install the package for your framework. For Laravel:
composer require perfbase/laravel:^1.0PERFBASE_ENABLED=true
PERFBASE_API_KEY=your-api-key
PERFBASE_SAMPLE_RATE=0.1Add the framework wiring for the lifecycle you want to profile. The extension captures the runtime trace, the framework package handles start and stop points, and the console gives you the analysis.
What you can debug with it
The useful part is not just knowing that a request was slow. It is seeing where the request spent time.
For example, a trace can show whether a slow JSON endpoint is spending time in:
- Eloquent hydration.
- API resources and serializers.
- Authorization policies.
- Collection transforms.
- Template rendering.
- Composer package callbacks.
- Cache calls, HTTP calls, or file operations.
That is the same gap described in Where Does PHP Request Time Go When the Database Is Not the Bottleneck?: database timings are valuable, but they often do not explain the whole request.
Query patterns, not just query lists
Database query panels are useful, but a long list of SQL statements can still hide the shape of the problem. Perfbase normalizes query text by replacing literal values with placeholders, then groups similar query shapes together.
When the same query structure repeats five or more times in a trace, Perfbase flags it as a potential N+1 pattern. You can see the normalized query, how many times it ran, and the total time spent by that pattern.
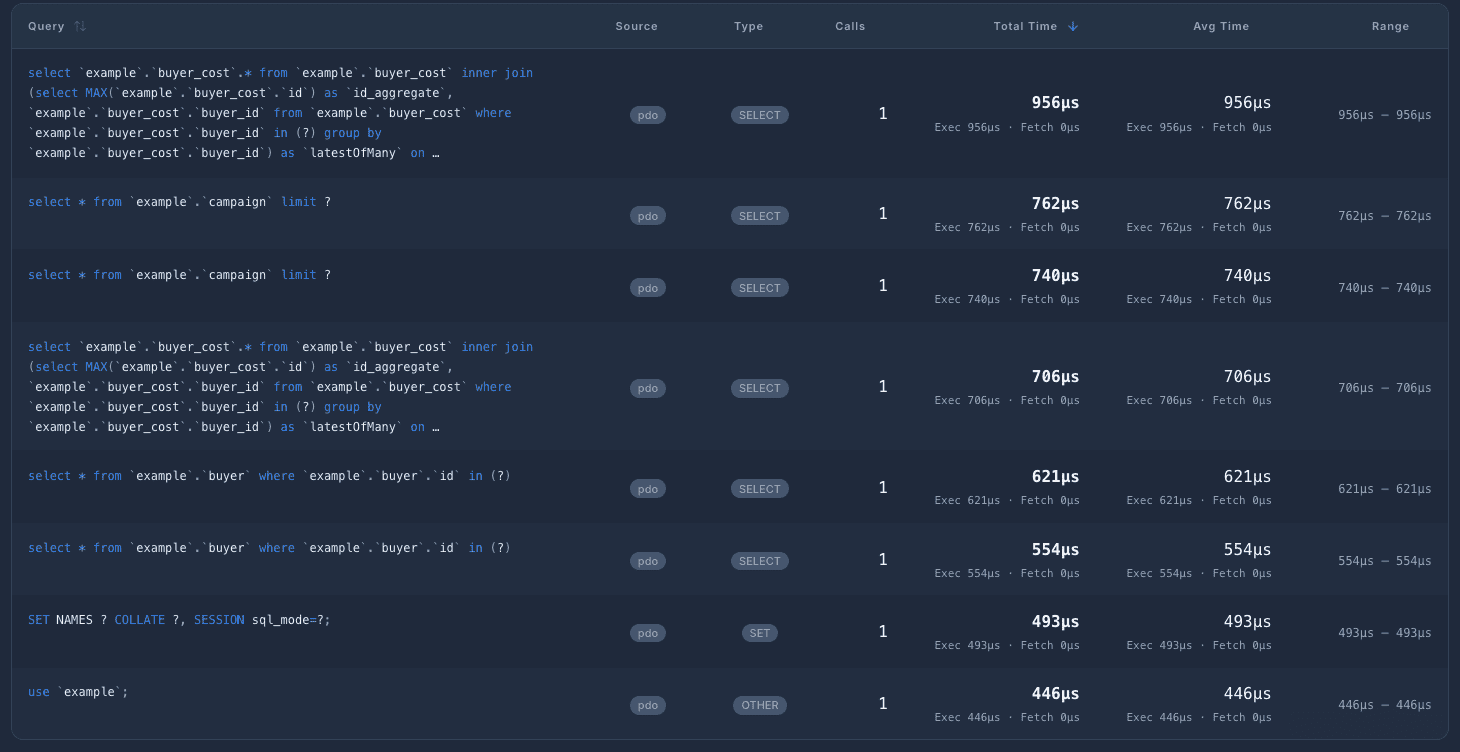
Query analysis keeps the SQL list tied to timing, source, type, call counts, execution time, and fetch time instead of leaving it as an isolated log.
For a Laravel-specific walkthrough, read Finding N+1 Queries in Laravel with Perfbase.
Flame graphs for PHP call paths
Flame graphs help you see the shape of a request quickly. Wide frames point to expensive call paths. Repeated narrow frames can point to loops or repeated work. Memory-heavy paths can be checked next to timing-heavy paths instead of treated as a separate investigation.
Perfbase renders interactive flame graphs from PHP traces. You can zoom into a subtree, search for a function, and move between the graph, function-level timing, query analysis, and trace context.
If flame graphs are new to you, start with Understanding Flame Graphs.
Call trees for the exact path
A flame graph is good for shape. A call tree is better when you need the exact parent-child path that led to an expensive function.
The Call Tree view keeps that hierarchy visible, including framework calls, application code, database calls, and the relative cost at each level. That is useful when a broad hotspot needs to become a concrete code path you can change.
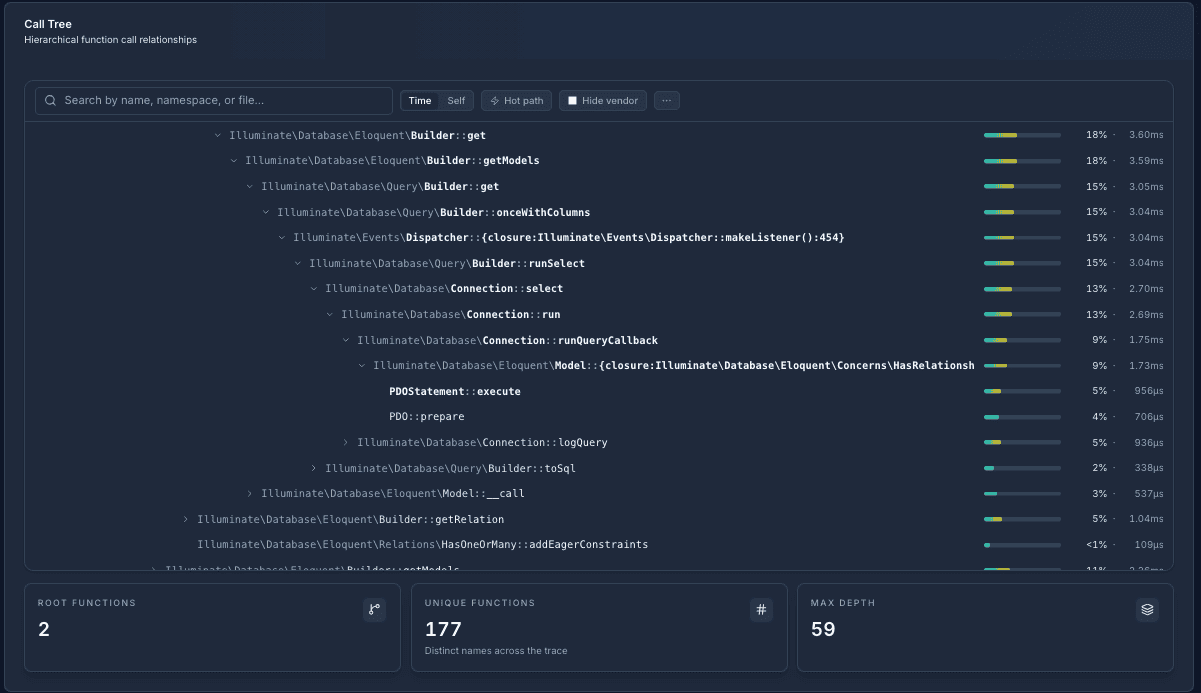
The call tree turns a hotspot into the concrete sequence of PHP function calls that produced it.
The console also includes a Call Graph view for visual orientation in large traces. It is less direct than a flame graph or call tree when you are making a code change, but it can make clusters of framework, application, database, and I/O work easier to see at a glance.
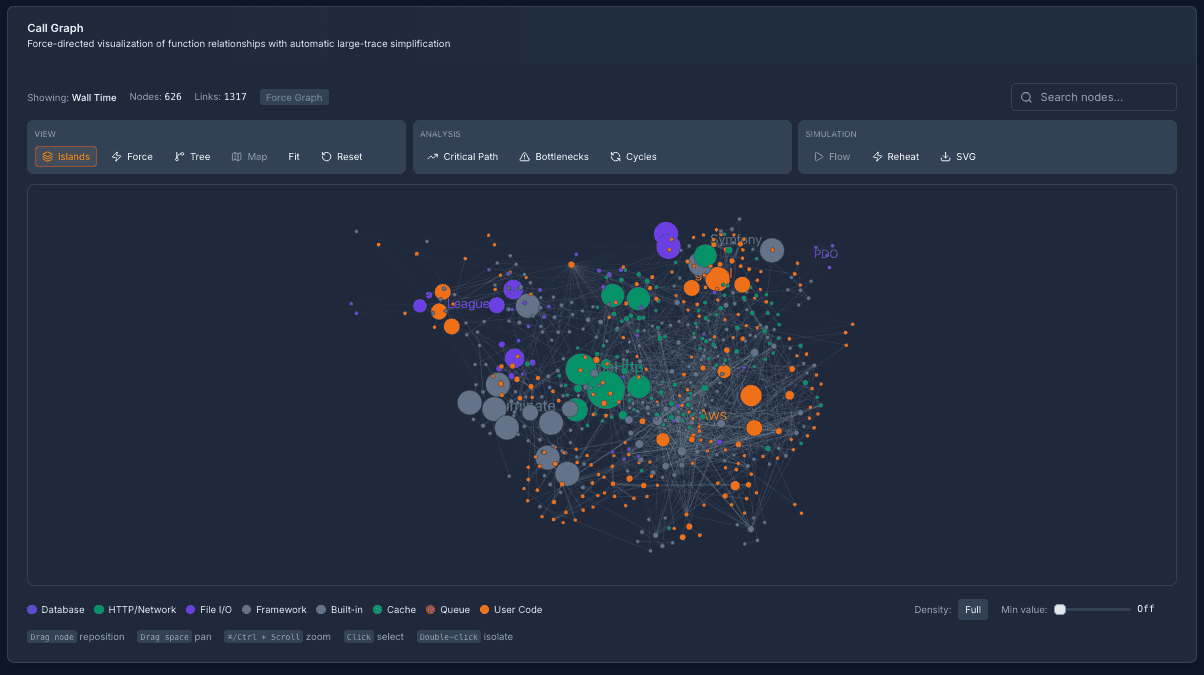
The call graph is a high-level map of a trace, useful for orientation before drilling into the exact path.
Host resources alongside the trace
Sometimes the PHP code path is the problem. Sometimes the same code ran while the host was busy, memory was climbing, another process was consuming CPU, or network activity spiked around the same time.
Host Resources keeps that context next to the trace. You can compare host CPU with PHP process CPU, check system memory against process memory, and see whether disk or network activity changed while the request was running. That helps separate “this script is expensive” from “this request happened during host pressure.”
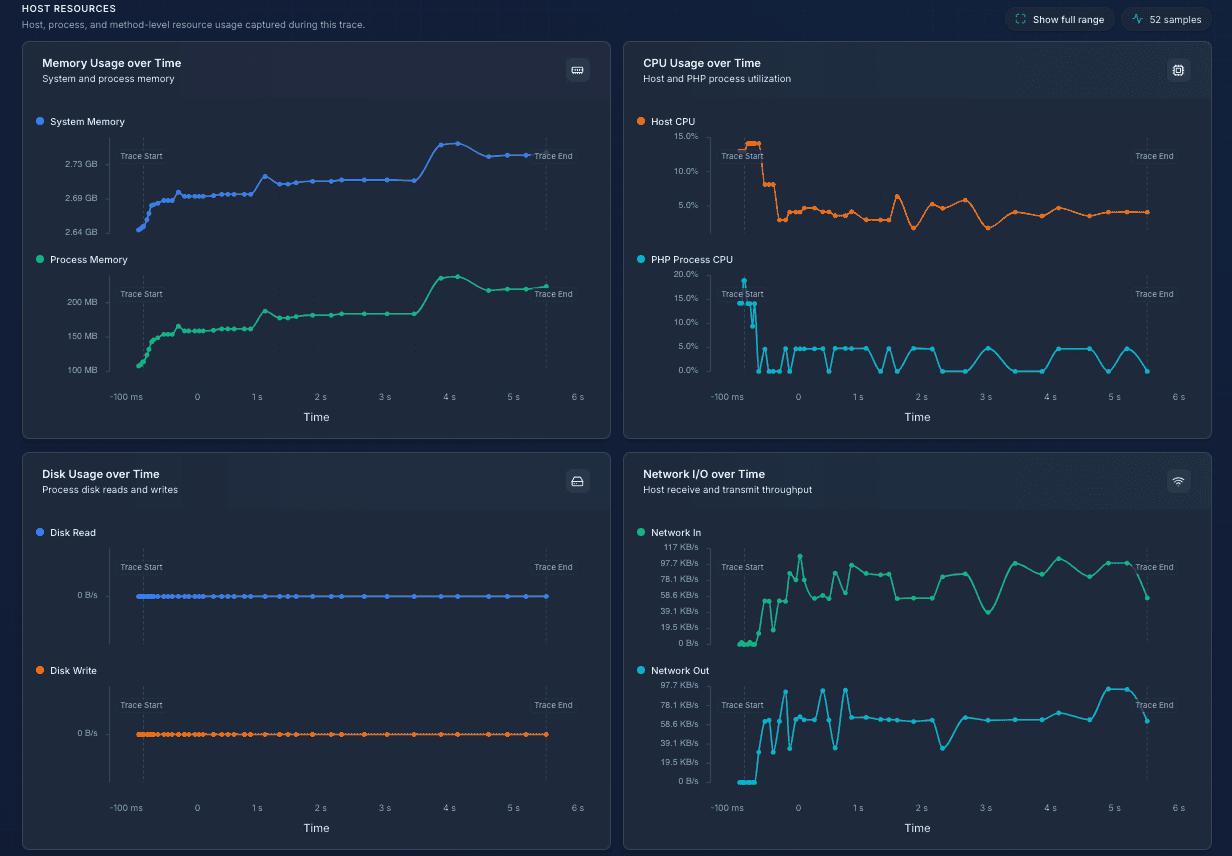
Host resource samples give the trace infrastructure context: host CPU, PHP process CPU, memory, disk, and network activity over the same request window.
Built around PHP runtime data
Perfbase trace payloads are serialized as MessagePack, compressed with Brotli, and submitted by the SDK or framework package. Sampling controls decide how much traffic to profile, and framework integrations let you capture the lifecycle that matters instead of guessing where to place manual timers.
The point is not to replace every debugging tool you already use. Logs, request dashboards, exception tracking, and framework debug panels all answer useful questions. Perfbase is for the next question: which PHP code path, repeated call, query pattern, or memory-heavy operation explains this slow action?
Supported PHP versions
The extension supports PHP 7.4 through 8.5, on Linux and macOS, x86_64 and ARM64.
Get started
Read the getting started guide, install the extension, and pick the integration that matches your application.
Building Perfbase - PHP performance monitoring for teams. Passionate about making PHP applications faster and more observable.
Related posts
Ready to profile your PHP application?
Start on the free-forever plan. No credit card required.