Know When a PHP Endpoint Slows Down Before Someone Reports It
Know When a PHP Endpoint Slows Down Before Someone Reports It
Most PHP performance problems do not start as a clean incident.
A reporting endpoint gets slower over a few days. A queue job that usually finishes quickly starts dragging after a new import path goes live. A WordPress AJAX action is fine most of the week, then becomes expensive during a scheduled campaign. A Laravel API route still works, but 5xx responses climb just enough that someone eventually notices in support.
The awkward part is not only the slowdown. It is the delay between the slowdown and the moment a developer sees it.
Perfbase already gives you the profile when you need to understand what happened inside PHP. The new alerting work adds the missing operational loop: define the conditions that matter for a project or action, preview what the rule would have done historically, and get notified when the rule enters warning or critical state.
Alerts should match the way PHP work is shaped
Generic system alerts are useful, but they rarely describe PHP application work at the right level.
CPU can be fine while one endpoint becomes expensive. The database can look healthy while PHP spends time hydrating models, serializing resources, rendering templates, running plugin hooks, or waiting on external HTTP calls. Overall project latency can stay acceptable while one queue action starts taking several seconds.
That is why Perfbase alerts are scoped around the same dimensions you use when debugging traces:
- Project-wide rules for broad health.
- Source-specific rules for HTTP requests, jobs, commands, or other trace sources.
- Environment-specific rules such as production only.
- Action-specific rules for a route, job, command, hook, or endpoint that needs its own guardrail.
That last point matters. A checkout route, report export, webhook handler, image-processing job, or POST /api/reports/{campaign}/histogram endpoint should not be forced to share one generic project threshold. If that action has its own normal range, it should have its own alert.
If you are still working out where a slowdown lives, start with a trace and the related debugging workflow in Where Does PHP Request Time Go When the Database Is Not the Bottleneck?. Once the important action is known, an alert keeps watching that surface for you.
Fixed thresholds for known limits
Some alerts are simple.
If an endpoint’s average duration should stay below 500ms, set a warning threshold at 500ms and a critical threshold higher. If a background action should run at least once per day, create a trace-count rule that warns when the count drops below the expected value. If 5xx rate should stay effectively zero, put a critical threshold on that metric.
Perfbase supports fixed thresholds for:
- Trace count and no-data style checks.
- 4xx and 5xx rates.
- Average and max duration.
- Average app time.
- Average SQL time.
- Average external HTTP time.
- Redis, Memcached, file I/O, NoSQL, and compile-time timing buckets.
The important detail is that fixed threshold alerts are based on the raw rollup value for the completed window. If the raw average duration, error rate, or count crosses the threshold, the rule can move into warning or critical state.
That keeps fixed threshold rules easy to reason about. The graph shows the raw metric. The rule compares against the warning and critical lines. The notification says which alert fired and which scope it applied to.
Anomaly alerts for weekly patterns
Fixed thresholds work well when you already know the number.
But some PHP work has a weekly rhythm. A reporting job may be quiet overnight and heavy after business hours. A WordPress admin action may spike on Mondays. A campaign endpoint may be active only during a certain operational window. In those cases, “above 500ms” can be too blunt.
Anomaly mode is built for that shape.
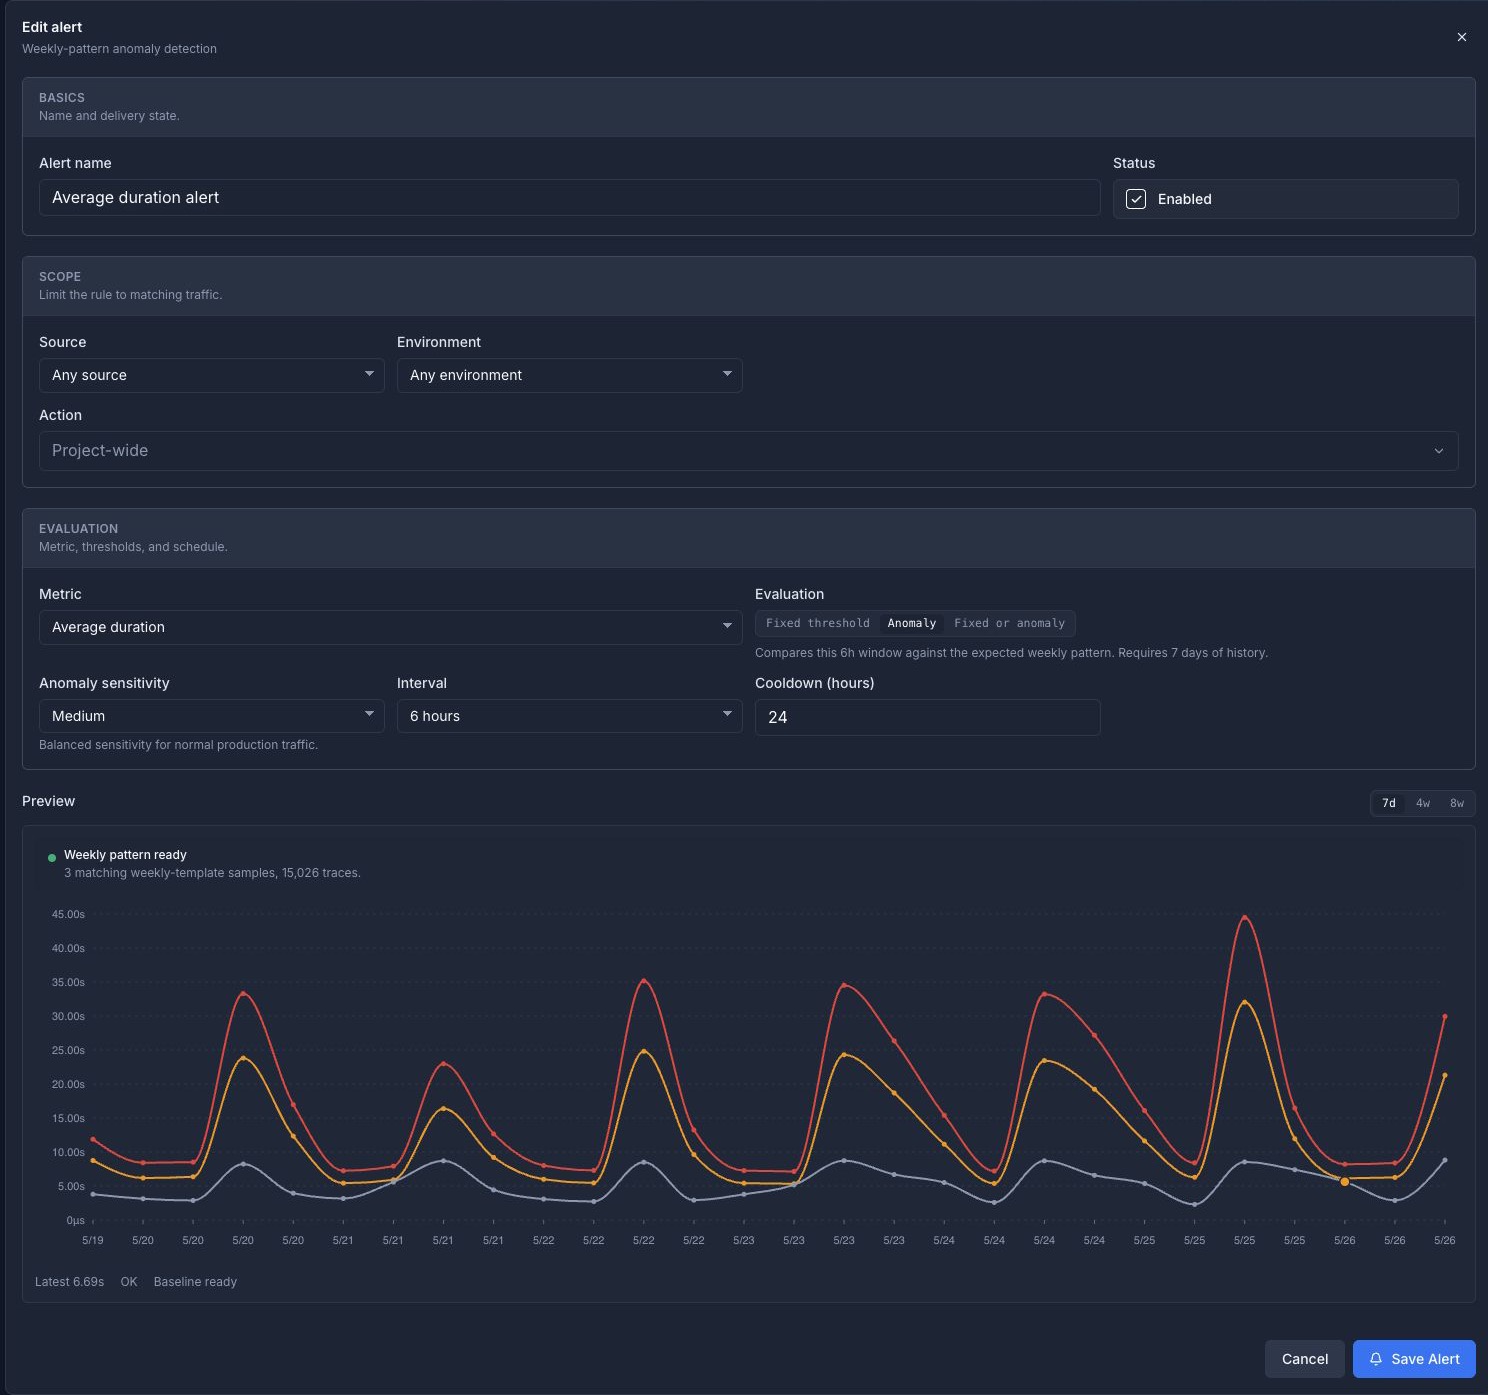
Instead of asking you to pick a static threshold, Perfbase compares the current completed six-hour window against the expected weekly pattern for the same alert scope. After there is enough rollup history, the rule can ask a better question:
Is this six-hour slot unusually high for this action, source, and environment?
For trace-count alerts, the direction is reversed. A missing or unusually low count can be the signal. That makes anomaly mode useful for actions that should happen regularly, but not necessarily at a flat rate all day.
The sensitivity control keeps the UI simple:
- Low catches larger deviations and should produce fewer alerts.
- Medium is the normal default.
- High catches smaller deviations once the baseline is ready.
The UI also tells you when the weekly pattern is not ready yet. Anomaly detection needs at least seven days of scoped rollup history, and it needs a matching weekly slot with enough samples for the chosen sensitivity. If the baseline is not ready, the configurator says that instead of silently pretending the alert is useful.
Preview before saving
Alert configuration should not feel like typing numbers into a form and hoping.
The alert configurator includes a preview graph for the selected metric and scope. You can switch between seven days, four weeks, and eight weeks of history, then see how the rule would have behaved before saving it.
For fixed threshold rules, the preview shows:
- Raw metric history.
- Warning and critical threshold lines.
- Warning and critical points where the rule would have fired.
For anomaly rules, the preview shows:
- Raw metric history.
- Expected warning and critical boundaries from the weekly pattern.
- Colored points where the simulated rule would have entered warning or critical state.
- Baseline readiness feedback when there is not enough history yet.
That feedback changes the way you tune a rule. If the warning line sits inside normal traffic, you can see that before the first notification. If high anomaly sensitivity would fire too often, the graph makes that visible. If a narrow action has too little data, the configurator says so.
The goal is not to turn alerting into statistics homework. The goal is to let you answer: “Would this rule have told me something useful last week?”
Notifications use the alert name
Every alert can have a human name.
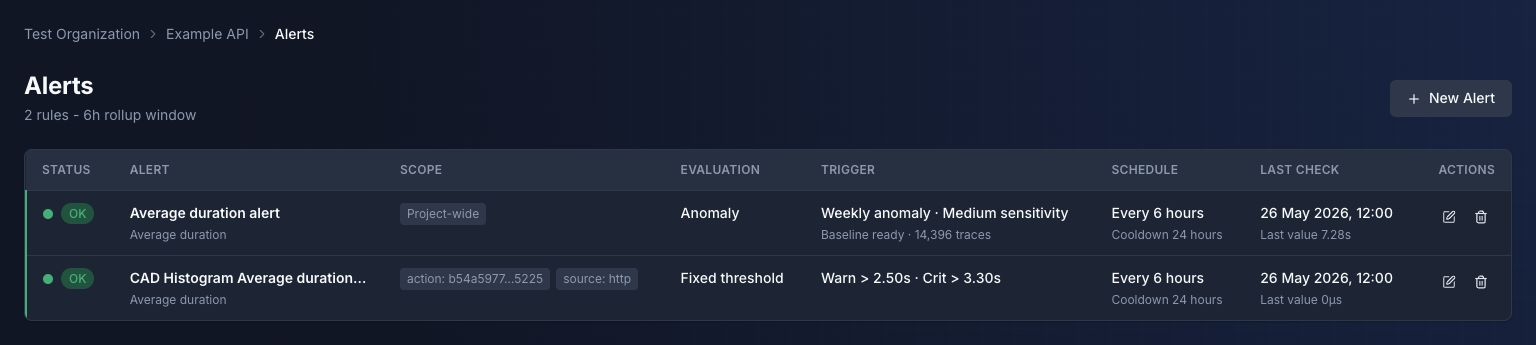
That sounds small, but it matters once notifications start moving through a team. “Critical performance alert: Average duration” is technically accurate, but not very useful when a project has several duration rules. “Critical performance alert: CAD histogram average duration” is the kind of title someone can act on.
Perfbase uses that alert name in in-app and email notifications. The body still includes the metric and scope, so the notification keeps enough context to tell whether the issue is project-wide, HTTP-only, production-only, or action-specific.
The configured alerts view is built for scanning: status first, then the human alert name, readable scope, evaluation mode, trigger summary, schedule, and last check. That keeps the list useful once a project has more than one rule watching different surfaces.
Notifications are sent when a rule enters warning or critical state, when it resolves, and after the configured cooldown while it remains firing. That keeps repeated alerts from turning one long-running condition into constant noise, while still allowing a new firing or resolution to come through.
Rollup-backed by design
Alerts should be cheap enough to run continuously.
Perfbase alert evaluation uses hourly alert rollups instead of scanning raw trace rows. The alert rollups keep the fields needed for the supported metrics: counts, error counts, duration totals, max duration, and timing bucket sums. Rules are then evaluated against completed windows from those rollups.
That matters for two reasons.
First, alerting should not become the most expensive query path in the product. A project with a lot of traces still needs alerts to evaluate predictably.
Second, rollup-backed alerts match the way teams need to operate. The purpose of an alert is not to inspect every raw trace. It is to notice that a project, source, environment, or action has moved out of range, then send the developer to the traces and profiles that explain why.
The investigation still belongs in the profiler. The alert is the signal that tells you when to look.
A practical workflow
Imagine a Laravel team has a reporting endpoint:
POST /api/reports/{campaign}/histogramIt is usually fast enough. Then campaign size grows, resource serialization gets heavier, and the endpoint starts drifting from 80ms to 300ms to multiple seconds.
With Perfbase alerts, the team can:
- Create an action-scoped alert for that route.
- Limit it to
source: httpandenvironment: production. - Start with an anomaly rule to catch weekly-pattern deviations.
- Use the preview graph to check whether high or medium sensitivity is noisy.
- Add a fixed critical threshold if there is a hard user-facing limit.
- Name the alert something readable, such as “Campaign histogram latency”.
When the alert fires, the next step is not to guess. Open the action, inspect recent traces, and use the profile to see whether the time went into SQL, external HTTP, application code, file I/O, cache calls, or a specific call path.
That is the loop Perfbase is trying to make shorter: detect the change, open the relevant profile, make the code change, and verify the action again.
Start with the surfaces that hurt
You do not need an alert for everything.
Start with the work that matters operationally:
- Checkout, billing, login, onboarding, and account routes.
- Heavy reporting or export endpoints.
- Webhook handlers that external systems retry.
- Queue jobs with customer-visible deadlines.
- WordPress AJAX, WooCommerce, or admin actions that are expensive when they regress.
- Scheduled commands that should run regularly.
For each one, decide whether the risk is “too slow”, “too many errors”, or “did not run when expected.” Then choose fixed threshold, anomaly, or both.
If you are new to Perfbase, start with the getting started guide and capture a few real traces first. Alerting is most useful once you know which actions are worth watching and what normal looks like.
Perfbase alerts are now part of that workflow: profile PHP work when you need the details, and let the console tell you when the next important action moves out of range.
Building Perfbase - PHP performance monitoring for teams. Passionate about making PHP applications faster and more observable.
Related posts
Where Does PHP Request Time Go When the Database Is Not the Bottleneck?
Next →Official WordPress Support Is Here
Ready to profile your PHP application?
Start on the free-forever plan. No credit card required.